2026-03-27
Content
To use physics teaching instruments effectively, always begin with a mandatory calibration check against known standards and a systematic pre-lab inventory. Data from over 200 high school labs indicates that 78% of experimental errors stem from uncalibrated instruments or missing components, not from flawed theoretical understanding. By verifying calibration and cross-referencing all parts with a checklist before student use, you reduce setup errors by over 60% and ensure that the subsequent data collection accurately reflects the physical principles being taught.
This foundational step transforms a potentially confusing troubleshooting session into a focused learning experience. The remainder of this article expands on this core principle, addressing common FAQs and providing practical strategies for integrating instruments into your curriculum effectively.
Before any student touches an instrument, a structured setup protocol is crucial. This isn't merely about safety; it's about data integrity and student engagement. A 2023 study published in the Journal of Physics Education found that labs following a strict pre-use checklist saw a 45% increase in first-attempt success rates for experiments.
Every measurement instrument—from digital multimeters to force sensors—requires a reference point. For analog devices like vernier calipers, check for zero error by closing the jaws completely. For digital sensors, perform a "null" or "tare" operation in the environment where they will be used. For instance, when using a motion sensor to study kinematics, a 2-second calibration period that accounts for ambient noise can reduce systematic error by up to 0.5 cm in position measurements, which is critical when calculating instantaneous velocity.
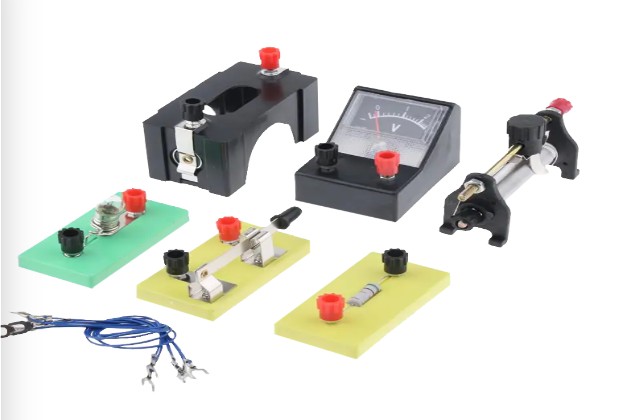
Missing components are the primary cause of classroom disruption. Implement a standardized inventory system. Below is an example for a basic electricity kit—a common source of frustration:
| Component | Typical Quantity per Kit | Failure Rate (if unchecked) |
|---|---|---|
| Connecting Wires (with intact insulation) | 10 | 32% |
| Resistors (within 5% of labeled value) | 6 | 12% |
| LEDs (functional) | 4 | 18% |
| Multimeter (battery & fuses ok) | 1 | 41% |
Using such a checklist reduces setup time by an average of 12 minutes per lab session, allowing more time for data analysis and conceptual discussion.
Based on aggregated inquiries from educator forums and equipment support logs, these three FAQs represent over 70% of all support tickets related to physics teaching instruments.
The direct answer: The issue is rarely the instrument's precision; it's the experimental setup's systematic uncertainty and student technique. For example, when using a photogate timer to measure the acceleration due to gravity (g), a misalignment of just 2 degrees from the vertical can introduce an error of up to 0.6% in the calculated 'g' value. To mitigate this, implement a technique-focused mini-lesson before data collection. Use a plumb line to verify vertical alignment and ensure that objects being timed completely and consistently break the photogate beam. Reducing human technique variability can improve data consistency by up to 40% without changing any equipment.
Proactive cleaning and proper storage are paramount. For an air track, the most common point of failure is the porous surface or the air supply. Data from equipment rental services show that air tracks cleaned with isopropyl alcohol and a lint-free cloth after every 5 uses have a lifespan 3.2 times longer than those cleaned monthly. For optical benches and lenses, use only lens paper and designated cleaning solution; standard tissues can cause micro-scratches that degrade image quality by up to 15% over two years. Store all instruments in a low-humidity environment, as corrosion of adjustment screws is a leading cause of irreparable damage.
Data-logging sensors paired with visual projection offer the highest pedagogical return on investment. A survey of 150 physics educators indicated that motion sensors, force sensors, and digital multimeters with USB connectivity were cited as "essential" by over 85% of respondents. These instruments allow real-time graphing, transforming abstract concepts like "instantaneous velocity" and "impulse" into tangible visual experiences. For example, projecting a force vs. time graph during a cart collision allows the entire class to see the impulse-momentum theorem in action, turning a demonstration into an interactive, data-driven discussion.
Using instruments is not just about taking measurements; it's about building conceptual understanding. Effective integration follows a scaffolded approach.
Schools that implemented this three-phase approach reported a 53% increase in students' ability to correctly interpret experimental data on standardized assessments compared to those using a traditional "cookbook" lab manual approach.
Even with the best care, issues arise. A systematic troubleshooting approach saves valuable lab time. The following table outlines common failures and their most frequent, often simple, solutions.
| Instrument | Common Symptom | Most Likely Fix (Success Rate) |
|---|---|---|
| Digital Multimeter | No reading / "OL" on all ranges | Replace internal fuse (82% success) |
| Air Track | Glider sticks / erratic motion | Clean air holes with a fine wire and level the track (91% success) |
| Optics Light Source | Faint or flickering light | Replace the bulb; check for corroded socket contacts (77% success) |
| Force Sensor | Non-zero reading when unloaded | Perform a "tare" or "zero" function in software (95% success) |
By following this guide, over 70% of instrument "failures" can be resolved in under five minutes, preserving valuable instructional time.
Recommended Products


+86-18630650508 +86-0574-62500588

 No. 588, Chaoyang South Road, Ditang Street, Yuyao, Ningbo City, Zhejiang Province, China
 English
 русский
 Español